In this entry I want to share with you, a little of my knowledge to show you how to plot a Mandelbrot Set without any library just JS, so go ahead!.
Note: If you are not familiar with the mathematical terms used here, I recommend you to read about complex numbers and fractals.
First of all, What a heck is a Mandelbrot Set?, according to mathworld:
A Mandelbrot Set, is used to refer both to a general class of fractal sets and to a particular instance of such a set. In general, a Mandelbrot set marks the set of points in the complex plane such that the corresponding Julia set is connected and not computable.
In a nutshell, a mandelbrot set is one of the most beautiful and famous fractal, that is defined by the set of complex numbers.
In the next picture you can see what I mean.

Figure 1: Mandelbrot set - black and white
In this entry you will learn how to plot in JS, the previous image.
But before, let's see a little more theory about how this set works.
Definition
As we mention before, the mandelbrot set is defined in the set of complex numbers c for which the function,
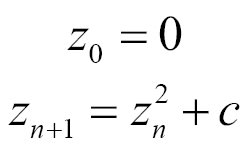
does not diverge when iterated from z = 0.
Below, the previous equation is broken down:
As you can see, the Mandelbrot set is obtained from the quadratic recursive equation where, z and c represents a complex number.
To represent visually this set we need to find, for each point c
of a part of the complex plane, if Zn is bounded. When the modulus of Zn is greater than 2, means that the number does not belong to Mandelbrot set, otherwise it is part of the set. The number of iterations to reach a modulus greater than 2 can be used to determine the color to use when we are plotting.
A complex plane can be represented in a normal 2D plane, where the X axis, will represent the real number, meanwhile the Y axis will represent the imaginary number, for instance, x = 3; y= 5i.
For a better understanding please refer to this video.
Plot of the Mandelbrot Set
Finally, after understand a bit of the Mandelbrot equation, it's time to implement it:
const MAX_ITERATION = 80
function mandelbrot(c) {
    let z = { x: 0, y: 0 }, n = 0, p, d;
    do {
        p = {
            x: Math.pow(z.x, 2) - Math.pow(z.y, 2),
            y: 2 * z.x * z.y
        }
        z = {
            x: p.x + c.x,
            y: p.y + c.y
        }
        d = Math.sqrt(Math.pow(z.x, 2) + Math.pow(z.y, 2))
        n += 1
    } while (d <= 2 && n < MAX_ITERATION)
    return [n, d <= 2]
}
- The mandelbrot function receives a complex number, it has real and imaginary part, here we are representing those components as x and y.
- The p variable contains the computing of the square of z, which is also a complex number, please refer to this, to understand how basic operations such as addition, subtraction and multiplication works in complex numbers.
- z is recalculated and now it contains the addition of the received complex number (c) and the previous z.
- d is the modulus of the new complex number (z), computed before.
- Add one when each iteration is completed (n += 1).
- The whole process is repeated while the modulus of z belongs to Mandelbrot set and the iteration number is less than 80.
- Finally, the function returns a tuple, with the iteration number that it took to reach a modulus greater than 2, and whether the complex number passed to it, belongs to Mandelbrot set.
And that's it!, we have implemented a mandelbrot equation.
Now is time to plot.
var canvas = document.getElementById('myCanvas')
var ctx = canvas.getContext('2d')

const WIDTH = window.innerWidth
const HEIGHT = window.innerHeight
ctx.canvas.width = WIDTH
ctx.canvas.height = HEIGHT

const REAL_SET = { start: -2, end: 1 }
const IMAGINARY_SET = { start: -1, end: 1 }

const colors = new Array(16).fill(0).map((_, i) => i === 0 ? '#000' : `#${((1 << 24) * Math.random() | 0).toString(16)}`)

function draw() {
    for (let i = 0; i < WIDTH; i++) {
        for (let j = 0; j < HEIGHT; j++) {
            complex = {
                x: REAL_SET.start + (i / WIDTH) * (REAL_SET.end - REAL_SET.start),
                y: IMAGINARY_SET.start + (j / HEIGHT) * (IMAGINARY_SET.end - IMAGINARY_SET.start)
            }

            const [m, isMandelbrotSet] = mandelbrot(complex)
            ctx.fillStyle = colors[isMandelbrotSet ? 0 : (m % colors.length - 1) + 1]
            ctx.fillRect(i, j, 1, 1)
        }
    }
}
- In the first lines, the canvas element is found and its context, then the window width and height is assigned to the canvas.
- REAL_SET constant represent the real numbers of Mandlebrot set, as you saw the Figure 1 of this entry, the domain in x axis goes from -2 to 1.
- IMAGINARY_SET represent, the imaginary numbers in y axis, the domain in y axis goes from -1 to 1.
- colors, store a list of 16 random hexadecimal colors.
-
draw function:
- The entire width and height of the canvas are iterated.
- The "complex" variable store a complex number; x and y, are calculated getting a relative value, of the width and height of the canvas, plus the values that belong to the mandelbrot set.
- mandelbrot function is called
- A color is assigned to canvas pixel, if the complex number passed to mandelbrot function belongs to set, the black color is chosen, otherwise the color depends of the number of iteration made by mandelbrot function.
- A pixel (rectangle of 1 width and height) is plotted in the position i, j.
That's all, we've finished, it was so easy! isn't it?
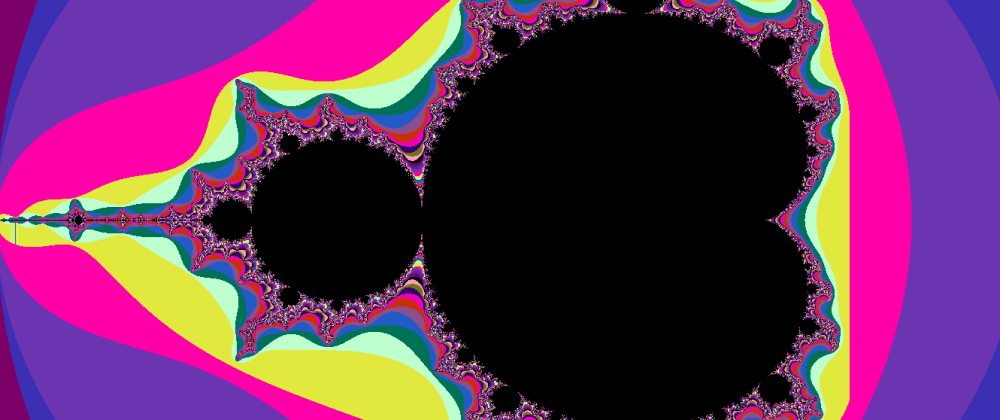
If we run the code, it shows the next figures.
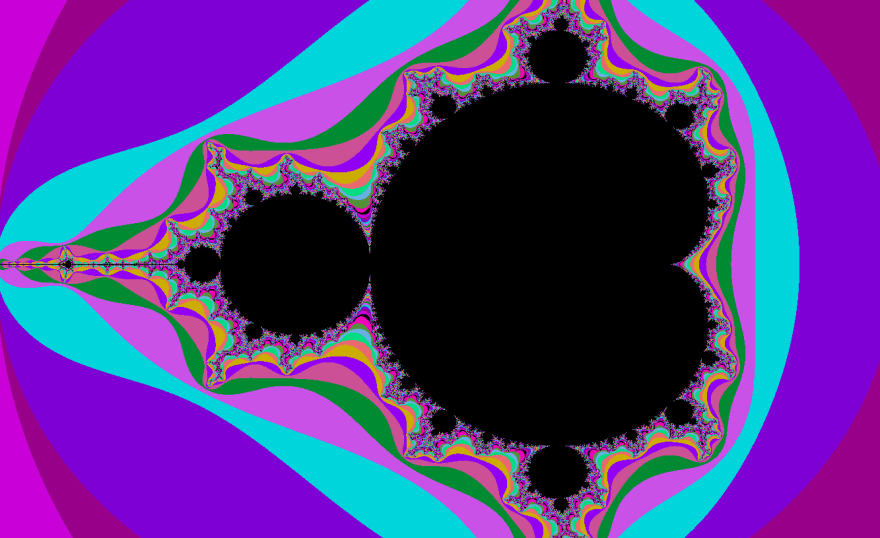
Figure 2. Mandelbrot set, example 1.

Figure 3. Mandelbrot set, example 2.
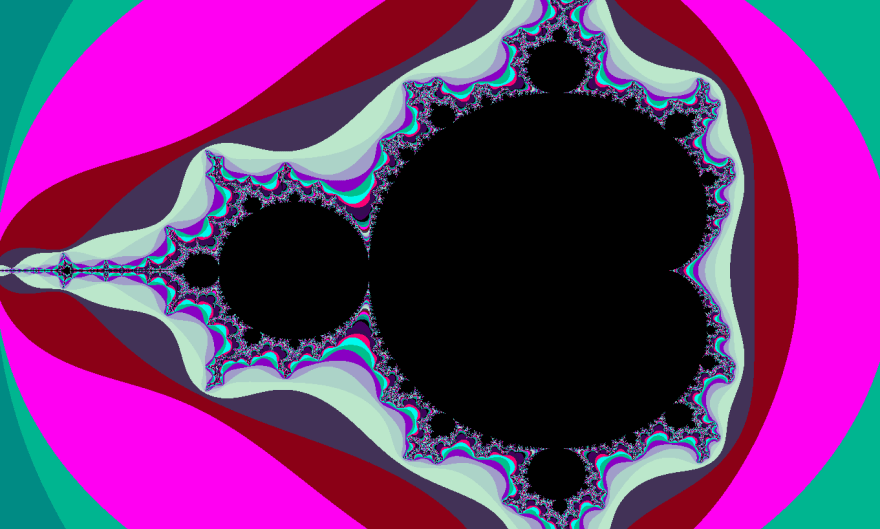
Figure 4. Mandelbrot set, example 3.

Figure 5. Mandelbrot set, example 4.

Figure 6. Mandelbrot set, example 5.
I hope you've enjoyed!.
By the way, It's my first blog, written entirely in English (I'm not a native speaker), maybe you've already realized, so sorry for the misspellings!, please If you have any recommendation, or comment you can leave in the comments section.
Next steps
Our fractal is plotted, so in the next entry I will implement the zoom, when a part of the image is clicked.
Stay safe and thanks for reading!