
In the previous blog, I explained a little bit about the theory behind the mandelbrot set, also I implemented a JavaScript version to plot it. In this blog I will show you, how to make the zoom effect on the set, using JavaScript and Workers.
The result of the zoom in will be as follows:
Now that you have just watched the video I know that you are very interested and curious, about it, so let's begin!.
I had thought this would be easy, however, it was complicated for several reasons that I summarize below:
- The code implemented in the previous blog was very inefficient O(n*m) in terms of time, also known as time complexity, which caused the amount of time needed to plot the entire canvas become too high.
- Despite several improvements I made to the algorithm, it was still very inefficient, so I decided to use workers.
Let's see how I solved the problems presented above.
Mandelbrot set
As usual with me, I will explain each piece of code used.
Some of code blocks were already explained in the previous blog, so I'm just going to focus on the new ones.
I declare worker to store the reference to my worker class, colorPalette to store a rgb colors, ZOOM_FACTOR, it's a scaling factor for the zoom in, and the last one is TASK, I will use it to save the index of each column of my canvas (I will enter into detail later).
const canvas = document.getElementById('myCanvas')
const ctx = canvas.getContext('2d')

const WIDTH = 800
const HEIGHT = 600
ctx.canvas.width = WIDTH
ctx.canvas.height = HEIGHT

let worker
let colorPalette = []
let REAL_SET = { start: -2, end: 1 }
let IMAGINARY_SET = { start: -1, end: 1 }
const ZOOM_FACTOR = 0.1
const TASKS = []
I decided to create a different palette color so I have used a simplified version of interpolation to create different colors.
const lagrange = ([X1, Y1], [X2, Y2], x) =>
   (((Y1 * (x - X2)) / (X1 - X2)) + ((Y2 * (x - X1)) / (X2 - X1)))

const makeRGB = (r, g, b, k) => {
    const calculate = pair => parseInt(lagrange(pair[0], pair[1], k))
    if (isNaN(r)) r = calculate(r)
    if (isNaN(g)) g = calculate(g)
    if (isNaN(b)) b = calculate(b)

    return [r, g, b]
}

const palette = (size = 250) => {
    const range = parseInt(size / 6)
    const colors = []
    let c
    for (let k = 0; k < size; k++) {
        if (k <= range)//red to yellow
            c = makeRGB(255, [[0, 0], [range, 255]], 0, k)
        else if (k <= range * 2)//yellow to green
            c = makeRGB([[range + 1, 255], [range * 2, 0]], 255, 0, k)
        else if (k <= range * 3)//green to cyan
            c = makeRGB(0, 255, [[range * 2 + 1, 0], [range * 3, 255]], k)
        else if (k <= range * 4)//cyan to blue
            c = makeRGB(0, [[range * 3 + 1, 255], [range * 4, 0]], 255, k)
        else if (k <= range * 5)//blue to purple
            c = makeRGB([[range * 4 + 1, 0], [range * 5, 255]], 0, 255, k)
        else//purple to red
            c = makeRGB(255, 0, [[range * 5 + 1, 255], [size - 1, 0]], k)

        colors.push(c)
    }
    return colors
}
In the previous code block, the function palette is creating 250 colors. The interpolation is done between 6 colors, those are: RED - YELLOW - GREEN - CYAN - BLUE - PURPLE
What result in a color palette called rainbow colors.
To improve time complexity in plot function, I will store in an array each column index; after that, the first index of the column will be sent (postMessage) to a worker which will calculate the values of each point that belongs to the rows.
In summary, only one line of each column of the mandelbrot set will be calculated at once.
const start = () => {
    for (let col = 0; col < WIDTH; col++) TASKS[col] = col
    worker.postMessage({ col: TASKS.shift() })
}
In the next code is explained how the rest of lines are calculated and plotted.
const draw = res => {
    if (TASKS.length > 0)
        worker.postMessage({ col: TASKS.shift() })

    const { col, mandelbrotSets } = res.data
    for (let i = 0; i < HEIGHT; i++) {
        const [m, isMandelbrotSet] = mandelbrotSets[i]
        c = isMandelbrotSet ? [0, 0, 0] : colorPalette[m % (colorPalette.length - 1)]
        ctx.fillStyle = `rgb(${c[0]}, ${c[1]}, ${c[2]})`
        ctx.fillRect(col, i, 1, 1)
    }
}
The draw function will receive the response of the worker as parameter, this contains the mandelbrot set values for a specific column. If there are still column values to calculate, a message with next column index is sent to worker. Then the line of values that has been calculated by the worker is drawn on the canvas.
This function will be called over and over again, as a recursive process, since the worker listens to the messages that are sent from this function and this in turn, listens to the messages sent by the worker, as long as there are column values to be processed.
Well, it's time to create the function that orchestrates each of the functions explained so far.
const init = () => {
    if (worker) worker.terminate()
    worker = new Worker('worker.js')
    worker.postMessage({ w: WIDTH, h: HEIGHT, realSet: REAL_SET, imaginarySet: IMAGINARY_SET, isSettingUp: true })
    start()
    colorPalette = palette()
    worker.onmessage = draw
}
I have called init to the function, which will be the first to run.
If worker already exists, this thread is killed.
After this, a new worker is created, then a message is sent to the worker, this first message is only to send the necessary parameters for the mandelbrot set computations.
Once the worker has been configured, the start function is executed.
Finally, draw function will listen the worker messages, worker.onmessage = draw, is a function to be called when the message event occurs.
Adding worker
Due to performance issues discussed at the beginning, the heaviest task that is mandlebrot set computations is moved to a worker.
//worker.js
let WIDTH, HEIGHT, REAL_SET, IMAGINARY_SET, END_START_RL, END_START_IM
const MAX_ITERATION = 1000

onmessage = e => {
    const { isSettingUp } = e.data
    if (isSettingUp) {
        const { w, h, realSet, imaginarySet } = e.data

        REAL_SET = { start: realSet.start, end: realSet.end }
        IMAGINARY_SET = { start: imaginarySet.start, end: imaginarySet.end }

        END_START_RL = (REAL_SET.end - REAL_SET.start)
        END_START_IM = (IMAGINARY_SET.end - IMAGINARY_SET.start)

        WIDTH = w
        HEIGHT = h
    } else {
        const { col } = e.data
        const mandelbrotSets = []
        for (let row = 0; row < HEIGHT; row++)
            mandelbrotSets[row] = calculate(col, row)

        postMessage({ col, mandelbrotSets })
    }
}

const calculate = (i, j) => mandelbrot(relativePoint(i, j))

const relativePoint = (x, y) => {
    x = REAL_SET.start + (x / WIDTH) * (END_START_RL)
    y = IMAGINARY_SET.start + (y / HEIGHT) * (END_START_IM)

    return { x, y }
}

const mandelbrot = (c) => {
    let z = { x: 0, y: 0 }, n = 0, p, d;
    do {
        p = {
            x: Math.pow(z.x, 2) - Math.pow(z.y, 2),
            y: 2 * z.x * z.y
        }
        z = {
            x: p.x + c.x,
            y: p.y + c.y
        }
        d = 0.5 * (Math.pow(z.x, 2) + Math.pow(z.y, 2))
        n += 1
    } while (d <= 2 && n < MAX_ITERATION)

    return [n, d <= 2]
}
The function onmessage, will listen for the messages that are sent from the main thread.
If is setting up, the necessary parameters for the computations are saved in the global variables and it does not send any message.
Otherwise, the values for the set are calculated for each of the columns, then those values are sent to main thread as response.
The functions relativePoint and mandelbrot were already explained in the previous blog.
Zoom In
We have already improved the time it takes to plot the mandelbrot set, but How the hell do I zoom in over this image?
Well, the answer is simple, it is only necessary to shrink the real and imaginary values each time that a specific part of the canvas is clicked.
Let's see the range of values that have the real and imaginary part:
- REAL_SET: the domain in x axis goes from -2 to 1.
- IMAGINARY_SET: the domain in y axis goes from -1 to 1.
So, the idea is to decrease each of the values that the set can take in both the real and imaginary parts.
For instance:
- REAL_SET: start -1, end: 0.5
- IMAGINARY_SET: start -0.5, end: 0.5
This is what the following function does every time that double click event occurs on a specific part of the canvas, according to a scaling factor (ZOOM_FACTOR).
//mandelbrot.js
canvas.addEventListener('dblclick', e => {
    const zfw = (WIDTH * ZOOM_FACTOR)
    const zfh = (HEIGHT * ZOOM_FACTOR)

    REAL_SET = {
        start: getRelativePoint(e.pageX - canvas.offsetLeft - zfw, WIDTH, REAL_SET),
        end: getRelativePoint(e.pageX - canvas.offsetLeft + zfw, WIDTH, REAL_SET)
    }
    IMAGINARY_SET = {
        start: getRelativePoint(e.pageY - canvas.offsetTop - zfh, HEIGHT, IMAGINARY_SET),
        end: getRelativePoint(e.pageY - canvas.offsetTop + zfh, HEIGHT, IMAGINARY_SET)
    }

    init()
})

const getRelativePoint = (pixel, length, set) =>
   set.start + (pixel / length) * (set.end - set.start)
Results
That's it, when you press double click on any part of the canvas, you will see the following images.

Figure 1. Mandelbrot set, example 1.

Figure 2. Mandelbrot set, example 2.

Figure 3. Mandelbrot set, example 3.

Figure 4. Mandelbrot set, example 4.

Figure 5. Mandelbrot set, example 5.

Figure 6. Mandelbrot set, example 6.

Figure 7. Mandelbrot set, example 7.
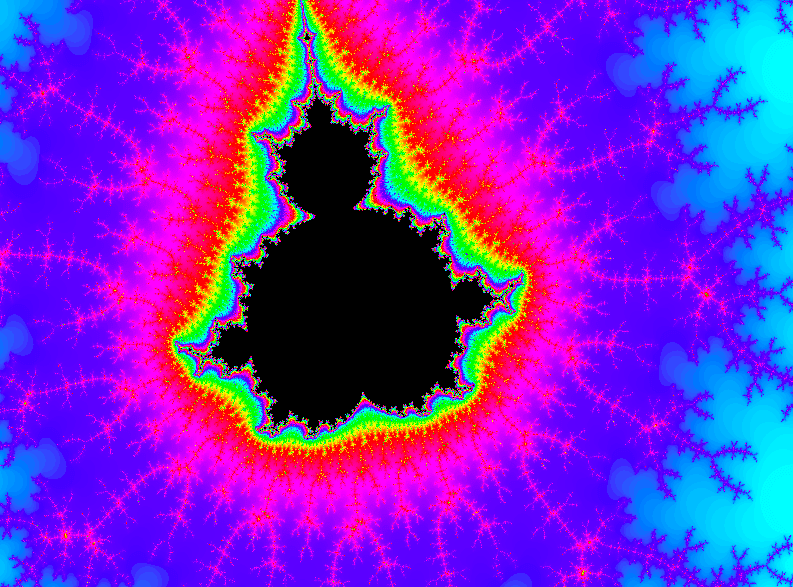
Figure 8. Mandelbrot set, example 8.
I encourage you to play around by modifying the color palette and zoom factor, for example try using the black and white color palette.
I hope you enjoyed!.
Stay safe and thank you so much for reading!